Sunday, December 12, 2010
Sunday Spinelessness - What makes a bee get busy
I've spend quite a lot of time peering into this little pile of weeds recently.

That's not because I'm particularly proud of our ability to grow some of the most extensive chickweed and onion weed beds in town. Those weeds are covering the entrance to a bumblebee nest.

I don't know what it is about them, but watching big, fat buzzy bumblebees fly about never fails to make me happy. So every now and again I wander down to check in on the nest and watch them going about their business. Which got me to thinking about a pretty cool paper I read a while ago. When Ralph Stelzer took bumblebee nests from The Netherlands to Northern Finland, where it's light for weeks on end during the summer months, the bees kept to their normal cycle of foraging during the "daytime" hours and sleeping under the midnight sun. So bumblebees obviously have some sort internal of body clock that isn't reset by the length of the day. But, I wondered, what else contributes to the rate at which the workers go out and forage? There is actually quite a literature just that topic, but a couple of weeks in the field or the lab can often save minutes in the library so I decided to try and find out for myself.
For the last month, whenever I've been working from home I've popped down to the nest every two hours or so (that's about when I need a break from thinking anyway) and counted how many workers fly in or out of the nest in a three minute period. I'm going to use that measure of nest activity as my "response variable", the data that I am trying to find an explanation for, in a statistical analysis. What "predictor variables" should I use to try an explain nest activity? We know from Stelzer's paper that bumblebees have a body clock, so time of day is an obvious predictor to include. Similarly, I know that bumblebees can only fly when their wing muscles are around 30°C and the nectar they forage is going to be more abundant when the sun is shining and it's warm, so ambient temperature and solar energy might predict when a bumblebee can fly. I don't have weather station in the backyard, but there is one about a kilomertre away so I used that to estimate both the temperature and the solar irradiance (the amount energy from the sun reaching the ground) at home. I'm pretty sure the nest was new when I first started observing it, so it might still have been building up its workforce over the first few days, in which case the day on which a record was made might contribute to the number of flights recorded. Finally, I actually got out and counted bees on one rainy day so I should include "rainy or not" as a predictor.
Now comes the most important step in any analysis, taking a look at the data. How do all those variables relate to the number of bees making their way to and from the nest?
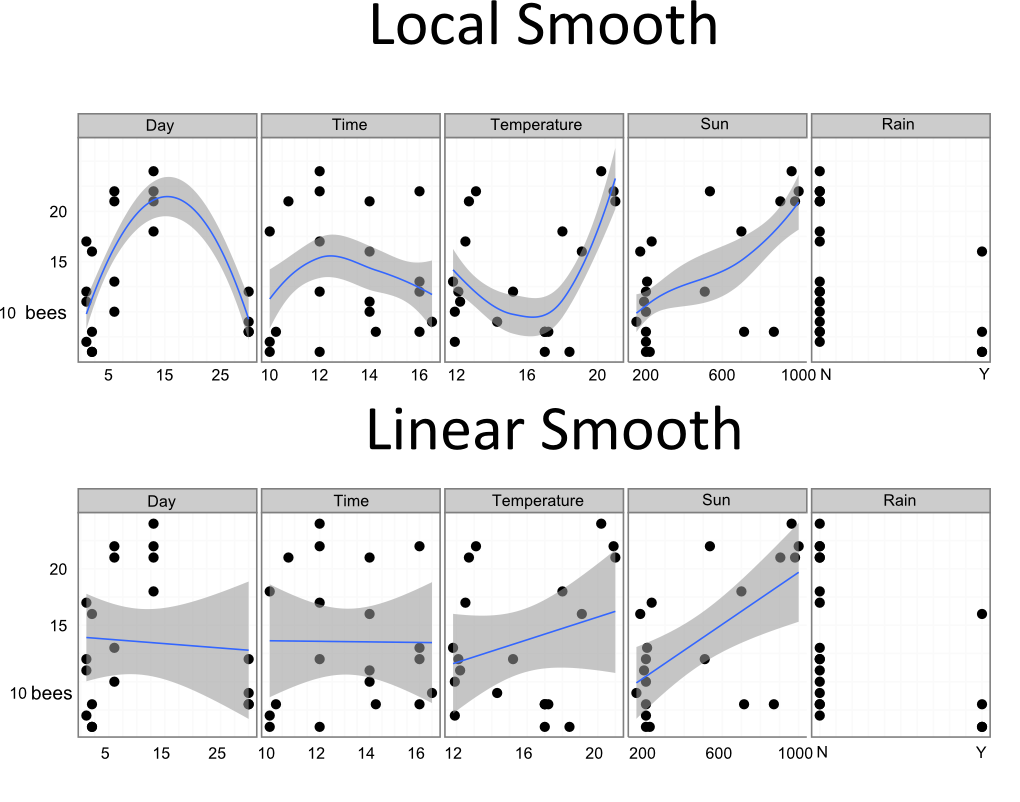
You can see a few relationships in the data, and some definite problems in the way I collected it. For one there is the massive gap between the second to last day and the final one. If I had made my records at more regular intervals I would have a better idea if that last day was an outlier if the local smooth's trajectory, with a peak in the middle, is the real pattern. Nevertheless, there are some clear patterns. Both temperature and solar irradiance seem to get bumblebees out there collecting nectar, and activity might peak around the middle of the day.
Having eye-balled the data, it's time to build a model to explain. I'm going to use a method called a generalized linear model (GLM). I realise it's a Sunday, and no one wants a stats leason on their day off, so here's the super-condensed summary of what the GLMs can do. They are really just an extension of the "plot some points and put a straight line through them" regressions displayed above. You include all the variables you think might contribute to the data you are trying to explain, then you can use some nifty tools to select a model that includes only those variables that are important predictors. In this case, we also need to explain that the "day", "time" and "temperature" variables might be better modeled as a curve rather than a straight line. You can probably remember from high school maths that the way to turn a straight line where y = x into a curved parabola is to square x, and to include a curved response for "day" we just include "day squared" in our GLM. So, our slightly terrifying looking starting point is a model like this:
number of bees = day + day2 + time + time2 + temp + temp2 + sun + rain
When we apply the nifty tools I talked about above to get rid of useless predictors, we get a less complex model that retains "rain", "temperature", "sun" and "day2" but gets rid of the rest.
log(number of bees)* = 1.83 + 0.05 . temp + 0.001 . sun + 0.001 . day2 - 0.6 . rain
The size of the numbers in those equations doesn't tell us much about their relative importance, since all the predictor variables are in different units. Instead, we need to look at how much of the variation in bee activity each of the retained variables explain:
| Variable | Percent variation explained** |
| day2 | 27 |
| rain | 14 |
| sun | 10 |
| temp | 10 |
So it seems the curved relationship between the day of observation and the number of bees explains more of the variation in the data that I collected than anything else. That's kind of annoying, since I'm not sure if the curved data with its peak of activity really descibes what's going on at the nest. Other than that long-term effect, we can see that bees fly when it's sunny dry and warm. Clearly I'm preparing this for Nature right now.
Of course, statistical models can only tell us how to explain the data they are given to test. My data is actually pretty crumby, estimating over-all activity using 3 minutes of data fits my schedule but it makes the estimate very rough. I only recorded between 10am and 4pm, even though bumblebees fly from dawn till dusk. I've also since learned that humidity is an important driver for foraging behavior and that variable isn't included in the model above. If you were looking for lesson in this post (I wasn't trying to write one) then it would be that any statistical analysis is only as good as the data you collect. If I was really serious about uncovering what made bumblebees tick, and I have enough time to do the question justice, then I'd been spending a lot more than 3 minutes on each record, and I'd be making a lot more then four records a day.
* The number of bees has to be log-transformed because, being counted data, it doesn't follow a nice bell-curve which is a requirement for a lot of statistical tests.
** Yes, my fellow stats geeks. This is a poisson-family GLM so it's actually a table of deviance but I thought this title better explained the what the numbers meant.
The Finnish bumblebee study is
Stelzer, R. & Chittka, L., 2010. Bumblebee foraging rhythms under the midnight sun measured with radiofrequency identification. BMC Biology, 8(1), 93.
Labels: bumblebee, geekery, sci-blogs, statistics, sunday spinelessness
9 Comments:
A couple of pointers on glms ---
1) Never use a Poisson glm:
Poisson regression assumes that the variance and mean are equal. This will usually result in severe underestimation of standard errors and make most of your inferences invalid. Use quasipoisson instead.
2) Never square a covariate without centring it first:
You'll lose identifiability between your coefficients for x and x^2, which can lead to some funny results in model selection.

I did center all the continuous variables (so I get one tick) but I didn't use the quasi-Poisson link because (terrible admission coming) I'm not sure how to do model selection with the quasi- families, or whether QAIC is a real thing!
Using quasipoisson regression for the same data the dispersion parameter is 1.2, so perhaps in this case the variance and mean are close enough to get away with it
Well done on getting the centring right! Possibly you're the first zoologist I've seen do that...
One final thing: you would normally want to 'nest' models in model selection, so you'd compare
stuff, x, x^2
stuff, x
stuff
but not stuff, x^2.
I think all Otago zoo. grads will have the centering thing drummed into them, so maybe you'll see it a bit more often. That and a distinct distaste for p-values ;)
I never LOL, but LOL!

But to log-transform count data might not be, well, appropriate. Might want to check Bob O'Hara's and Johan Kotze's paper from 2010 on that.
cheers,
a.
I'm not sure what it is that you meant by 'signal word' but you fears re: the log transform can at least be allayed.
O'Hara and Kotze are telling folks not to log-transform their data then do normal tests, instead suggesting they use a glm. Which I did here, though, as pete points out, I should have used the quasipoisson link (since what I did almost log-tranform and test)

All content not otherwise marked is licensed under a Creative Commons Attribution-ShareAlike 3.0 Unported License.