
Sunday, September 11, 2011
Sunday Spinelessness - Visualising fungal communities
Inevitably, I found myself needing a break from thinking about my snails this week, so had another crack at comparing fungal diversity by host. In particular, I've filtered through hundreds of records of fungi collected from New Zealand to isolate those collected from natural southern beech (Nothofagus) forests or plantation pine forests. The mycorrhizal fungi I talked about last week are generally considered to be highly host-specific and unable to form relationships with off-host species. If that's true we should be able to see that the community of fungi recorded for each forest type is quite distinct. But how can we see that phenomenon? Last week I used a graph of the frequency of different taxonomic families to show how diverse the community living on silver beech was, but taxonomic ranks above species don't represent anything real about biology or biodiversity. I have argued species are natural units of biodiversity (even if we can struggle mightily to identify those units), but most of the sequences I've found aren't annotated down to this level (in fact, most probably represent undescribed species). So, I gave up on a 'unit of biodiversity' and instead only included sequences for a particular gene loved by fungal geneticists called the Internal Transcribed Spacer. Using just these sequences, I can make a phylogenetic tree, which attempts to relate DNA sequences to each other based on their similarity.
So here's the tree, drawn as a big circle. Each tip represents a single DNA sequence and is shaded according to the forest it comes from - brown for pine, green for beech. As you can see, the pine and the beech forests have very different fungal communities. There are whole swathes of the tree that are unique to to beech forests (although, of course, that could be an artifact of the effort to which people have sampled) and whenever you see a brown branch within a predominantly green section of the tree, that branch is substantially distinct from its beech-living relatives. (click on the image to be taken to an interactive version, where you can add information on host species or change the shape of the tree):

So that's fun. There's still a lot more that could be done with the data set. I haven't included much data about the fungi themselves - it would be interesting, for instance, to see if the fungi living in the roots of trees showed more or less specificity than the those living elsewhere. It might also be possible to use these sequences to estimate the number of species they represent using some of the new-fangled species delmitation methods the DNA Barcorders have come up with. There are also other natural forest types in New Zealand that might be interesting to include. Both Manuka and Kanuka rely have mycorrhizal fungi and including those species might help us to understand if the differences displayed above are about natural v plantation forests or about host-specificity in the fungal species.
I didn't include any code snippets today, because I've set up a github repository as an 'open record book' instead. If you're interested in the process or the code that went into this you can check it out there (though I should warn you, there's nothing very clever going on).
Labels: biopython, environment and ecology, fungi, geekery, python, sci-blogs, science, sunday spinelessness

Sunday, December 12, 2010
Sunday Spinelessness - What makes a bee get busy
I've spend quite a lot of time peering into this little pile of weeds recently.

That's not because I'm particularly proud of our ability to grow some of the most extensive chickweed and onion weed beds in town. Those weeds are covering the entrance to a bumblebee nest.

I don't know what it is about them, but watching big, fat buzzy bumblebees fly about never fails to make me happy. So every now and again I wander down to check in on the nest and watch them going about their business. Which got me to thinking about a pretty cool paper I read a while ago. When Ralph Stelzer took bumblebee nests from The Netherlands to Northern Finland, where it's light for weeks on end during the summer months, the bees kept to their normal cycle of foraging during the "daytime" hours and sleeping under the midnight sun. So bumblebees obviously have some sort internal of body clock that isn't reset by the length of the day. But, I wondered, what else contributes to the rate at which the workers go out and forage? There is actually quite a literature just that topic, but a couple of weeks in the field or the lab can often save minutes in the library so I decided to try and find out for myself.
For the last month, whenever I've been working from home I've popped down to the nest every two hours or so (that's about when I need a break from thinking anyway) and counted how many workers fly in or out of the nest in a three minute period. I'm going to use that measure of nest activity as my "response variable", the data that I am trying to find an explanation for, in a statistical analysis. What "predictor variables" should I use to try an explain nest activity? We know from Stelzer's paper that bumblebees have a body clock, so time of day is an obvious predictor to include. Similarly, I know that bumblebees can only fly when their wing muscles are around 30°C and the nectar they forage is going to be more abundant when the sun is shining and it's warm, so ambient temperature and solar energy might predict when a bumblebee can fly. I don't have weather station in the backyard, but there is one about a kilomertre away so I used that to estimate both the temperature and the solar irradiance (the amount energy from the sun reaching the ground) at home. I'm pretty sure the nest was new when I first started observing it, so it might still have been building up its workforce over the first few days, in which case the day on which a record was made might contribute to the number of flights recorded. Finally, I actually got out and counted bees on one rainy day so I should include "rainy or not" as a predictor.
Now comes the most important step in any analysis, taking a look at the data. How do all those variables relate to the number of bees making their way to and from the nest?
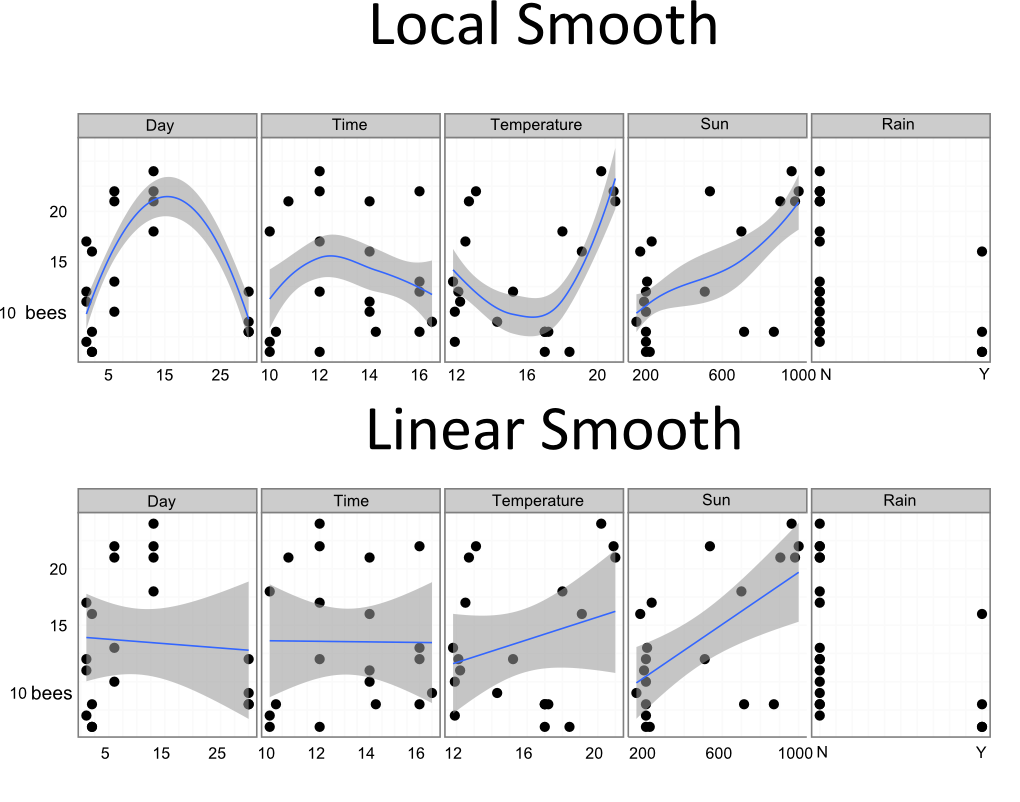
You can see a few relationships in the data, and some definite problems in the way I collected it. For one there is the massive gap between the second to last day and the final one. If I had made my records at more regular intervals I would have a better idea if that last day was an outlier if the local smooth's trajectory, with a peak in the middle, is the real pattern. Nevertheless, there are some clear patterns. Both temperature and solar irradiance seem to get bumblebees out there collecting nectar, and activity might peak around the middle of the day.
Having eye-balled the data, it's time to build a model to explain. I'm going to use a method called a generalized linear model (GLM). I realise it's a Sunday, and no one wants a stats leason on their day off, so here's the super-condensed summary of what the GLMs can do. They are really just an extension of the "plot some points and put a straight line through them" regressions displayed above. You include all the variables you think might contribute to the data you are trying to explain, then you can use some nifty tools to select a model that includes only those variables that are important predictors. In this case, we also need to explain that the "day", "time" and "temperature" variables might be better modeled as a curve rather than a straight line. You can probably remember from high school maths that the way to turn a straight line where y = x into a curved parabola is to square x, and to include a curved response for "day" we just include "day squared" in our GLM. So, our slightly terrifying looking starting point is a model like this:
number of bees = day + day2 + time + time2 + temp + temp2 + sun + rain
When we apply the nifty tools I talked about above to get rid of useless predictors, we get a less complex model that retains "rain", "temperature", "sun" and "day2" but gets rid of the rest.
log(number of bees)* = 1.83 + 0.05 . temp + 0.001 . sun + 0.001 . day2 - 0.6 . rain
The size of the numbers in those equations doesn't tell us much about their relative importance, since all the predictor variables are in different units. Instead, we need to look at how much of the variation in bee activity each of the retained variables explain:
| Variable | Percent variation explained** |
| day2 | 27 |
| rain | 14 |
| sun | 10 |
| temp | 10 |
So it seems the curved relationship between the day of observation and the number of bees explains more of the variation in the data that I collected than anything else. That's kind of annoying, since I'm not sure if the curved data with its peak of activity really descibes what's going on at the nest. Other than that long-term effect, we can see that bees fly when it's sunny dry and warm. Clearly I'm preparing this for Nature right now.
Of course, statistical models can only tell us how to explain the data they are given to test. My data is actually pretty crumby, estimating over-all activity using 3 minutes of data fits my schedule but it makes the estimate very rough. I only recorded between 10am and 4pm, even though bumblebees fly from dawn till dusk. I've also since learned that humidity is an important driver for foraging behavior and that variable isn't included in the model above. If you were looking for lesson in this post (I wasn't trying to write one) then it would be that any statistical analysis is only as good as the data you collect. If I was really serious about uncovering what made bumblebees tick, and I have enough time to do the question justice, then I'd been spending a lot more than 3 minutes on each record, and I'd be making a lot more then four records a day.
* The number of bees has to be log-transformed because, being counted data, it doesn't follow a nice bell-curve which is a requirement for a lot of statistical tests.
** Yes, my fellow stats geeks. This is a poisson-family GLM so it's actually a table of deviance but I thought this title better explained the what the numbers meant.
The Finnish bumblebee study is
Stelzer, R. & Chittka, L., 2010. Bumblebee foraging rhythms under the midnight sun measured with radiofrequency identification. BMC Biology, 8(1), 93.
Labels: bumblebee, geekery, sci-blogs, statistics, sunday spinelessness
Monday, August 24, 2009
Link taxonomic names on any website to the Encyclopedia of Life
The Encyclopedia of Life is a project aimed at compiling information on each of the 1.8 million species that scientists have so far described and making that information available to students, scientists and anyone that wants to know a bit more about life on earth. The project is now a couple of years old (I actually wrote about its launch here) and is starting to build up information and some pretty cool tools to get at that information.
Earlier this month the EoL released NameLink, a service that searches a web-page for taxonomic names and then adds links to from those names to their records in various taxonomic databases. At present the only way for a user to get those links to show up is to copy page's url, surf over to the NameLink page and paste it into their handy form. Which is fine, but I am very lazy so I wanted to be able to add the links while I was reading a page, thankfully the EoL include an API for NameLink that made it very easy to write a ubiquity command and some bookmarklets that allow me to be as lazy as I want.
If you have ubiquity installed you can follow this link and install the "taxonomize" command or you can drag the following links on to you bookmarks toolbar to get commands that will add links the EoL and the The Global Biodiversity Information Facility with a single click:
EoL Taxonomize! GBIF Taxonomize!
The ubiquity command allows you to choose which database to link to by providing one of the following abbreviations after the taxonomise command:
col: Catalogue of Life
eol: Encyclopedia of Life
gbif: Global Biodiversity Information Facility
gni: Global Names Index
itis: Integrated Taxonomic Information System
namebank: uBio Namebank
The commands in action
Once you have your have a command or a bookmarklet ready to go then next time you find yourself reading a page rich in taxonomic names like this post on Dechronization about anole hunting in Haiti you'll be able to use the command to get to this page which has all the species names linked:

From which point new information on the handsomely dewlapped Anolis distichys venosus is just a click away
Labels: geekery, might interest someone, sci-blogs, taxonomy, technology
Friday, August 14, 2009
Quickly change firefox proxy settings with ubiquity
I really like the Firefox add-on ubiquity because it delivers the future that science fiction always promised we'd have - you type in a few simple English words and the computer (or at least the browser) does stuff for you. So, if you are reading an article that mentions one of my very favourite fossil genera Ambulocetus and you want to know a bit more about it you only need to highlight the name, type alt-space to bring up ubiquity then type 'wiki' to see a bunch of links to articles in wikipedia:

Ubiquity recently changed the way it deals with user-written commands so when I updated I lost one of my favourites, Julien Courveur's proxy-set command for toggling firefox's connection settings between a direct connection and various proxy settings without the massive imposition of four mouse-clicks required to do this via the menus. So I rewrote if for the 'new' ubiquity, this is what it looks like when it's working

If you visit this site with Ubiquity installed it will ask if you to want add the set-proxy command.
Labels: geekery

All content not otherwise marked is licensed under a Creative Commons Attribution-ShareAlike 3.0 Unported License.


