
Sunday, September 4, 2011
Sunday Spinelessness - An online fungal foray
One of my goals with these Sunday posts is to do a little to broaden the understanding of just how extraordinarily diverse the biological world is. In almost two years of writing about spineless creatures I've limited myself to animals, which, as amazing as we are, only comprise one twig in the tree of life. You can call that an institutional bias, since I'm from a Zoology Department (there are few that haven't yet been swallowed by Schools of Life Sciences) and maybe it's a necessary step to narrow the field of targets a little bit. But this is my blog, and my series, and today I want to write about fungi.
In fact, fungi are a prefect example of the gap between our everyday experience of the biological world and what's really out there. Most of us only notice fungi when mushrooms start popping up in the autumn or when the fruit we bought, and were definitely going to eat this time, starts turning furry. In fact, there might be something like one and a half million species of fungi on earth; there are deep-sea fungi, forest fungi and freshwater fungi; there are fungi that live on tree roots and others that live on human skin; there are even mind-controlling fungi that hijack the nervous system of certain ant species for their own gain:
Some fungi play important roles in ecosystems, and probably the most important of all are a taxonomically diverse group that livr in or on the roots of plants. These so called 'mycorrhizal' fungi greatly increase their host's ability to take up and process nutrients and water from the soil, while the fungi can take advantage of the plant's ability to create sugars from carbon dioxide and sunlight. Between 80 and 90 per cent of plant species can form relationships with mycorrhizal fungi (Wang and Qui 2006 doi: 10.1007/s00572-005-0033-6) and, as you might imagine, the presence or absence of mycorrhiza can have a big impact on the health of individuals plants, crops and forests.
On Wednesday, I heard David Orlovich (@davidorlovich) speak about mycorrhiza in southern beech (Nothafagus) forests in New Zealand. Beech forests form a major part of New Zealand's natural heritage, and some our most important conservation sites (Westland, Fiordland...) are covered almost exclusively by beech species. Without mycorrhizal fungi there would be no Southern Beech: seedlings raised in sterile soil simply fail to develop. David went as far as to say that we should see beech trees as giant antennae that fungi used to fix carbon from the atmosphere. I'm not sure I'd follow him quite that far, but his talk on using DNA sequences to quantify the number of fungal species associated with local silver beech forests and the the specificity of fungal species was really interesting.
It also got me thinking about a blog post by Rod Page (@rdmpage) in which he shows how we can take advantage of data that is stored in The Big DNA Database (called GenBank) but goes almost unused. Every record in GenBank has certain information attached to the DNA sequence in describes (the source of the sample, the name of the gene, a scientific paper the sequence is attached to) but the information in a given record is not limited to the required fields - researchers can add any pertinent information they want to. Researchers in biodiversity and related fields often wring their hands about the lack of any infrastructure to hold data collected on various species and taxonomic groups, but, as Rod has pointed out in the past, existing databases (and wikipedia) already contain considerably more information than we're taking advantage off.
So, when I decided I needed a break from thinking about snails this Friday night, I set out to see if there was enough information about fungal hosts in GenBank for us to start examining the fungal diversity of New Zealand forests*. You could make a start at that project using the pointy-clicky web-interface but I decided to use Biopython (a library for the Python programming language), because writing code for a project is really the best way to document what you're doing , helps make you research reproducible and allows you to pick up a project where you left it. So, the first step was finding records that corresponded to sequences from mycorrhizal fungi in New Zealand. As far as I can tell you can't search within particular submitter-defined features of a file, so here's how I did the search with Biopython's Entrez.esearch() function.
The 'ids' object collected form that search is a list of unique identifiers for sequence records that matched our search, so let's get all of those records in a sequence file and use SeqIO from Biopython to deal with them
Now the heavy lifting! We need to get the host information from each record which means looping through a bunch of attributes in the Biopython object representing that record. We want to store the data as a "one to many" relationship, since each host species might have multiple fungal species associated with it. There are couple of different ways of doing that, but I used python's very cool "defaultdict" dictionary which can create a list for each host and add new information to that list when it encounters the host.
And this is where everything went wrong. Well not quite, the search term I used found 84 records, but they were all for fungi collected from silver beech (Nothofagus menziesii) trees. So much for comparing diversity between hosts! Still, those 84 records give us a change to estimate the taxonomic diversity of fungi associated with this tree, so lets count up all the unique taxonomic names among these records:
And (dropping python for R and ggplot2) a graph (click for a larger version):

I'm not finished with this little project, I have some ideas to widen the net for fungal species next time I get really sick of snails, but even this little exercise shows some interesting things. First, silver beech have lots of fungi on their roots, and they come from lots fo different groups! It would be fascinating to know if the fungal families represented above were playing different roles in the root-tip, or if each was competing with others. Or how that make-up of the fungal biota attached to a given tree or a given forests effects its health. More importantly, GenBank is potentially a really useful way for researchers to share more than just sequence data. If people working on mycorrhizal fungi decided on a de facto standard for the way they annotated their GenBank submissions then data from hundreds of published (and unpublished) studies could be almost effortlessly combined to create a big picture of the dynamics of these important fungi. Even as it is now, there is a source of data that is almost never used by researchers or people building the various "encyclopedia of life" projects, and it doesn't take too much tinkering to see how it could be put to use.
*Yes, I'm the sort of person who takes a break from science by doing some other science. On a Friday night. What of it?
Labels: biopython, code, fungi, pretty data, python, sci-blogs, sunday spinelessness, taxonomy

Friday, November 19, 2010
Ken Ring can't predict the weather
It's that time of year for academics in New Zealand. As soon as undergrad teaching finishes every department, organisation and society on campus decides to schedule some sort of meeting,conference or symposium - since everyone will have so much spare time. Between the three talks I'm going to end up giving this month, and the tonne of work I have to get done between them, I don't have much time to write here. So, partly inspired by people talking abut their months-old posts in Grant's piece on the length of time it can take to put a blog post together, I've decided to dive in The Atavism's "draft" folder and resurrect a few half-written posts. This one took about two months to write, and though I never quite got the copy right I do rather like the graph.
Ken Ring was on National Radio a couple of months ago, blathering on about his method of weather prediction. Ring thinks he can provide a forecast for any future date by looking at weather map that's about 18 years out of date That's how long it takes for the earth, the moon and the sun to cycle into the same relative positions in their orbits, and Ring thinks it's the moon that drives weather down here on earth. The 18 year old weather map will tell him what the atmosphere was doing last time everything lined up this way, and that will be enough to predict the next event. You probably agree that Ring's methods sound like lunacy, but Ring continually claimed in his time on air that his method had an 85 % accuracy rate. Reading Ring's website, you can see he is pretty generous when he estimates his own accuracy, like the Texas sharpshooter who shoots the side of a barn then paints a target around the bullet hole to show his prowess with a shooting iron, Ring uses any vaguely similar weather event to prop up the accuracy of his predictions. My particular favourite from that page is his prediction for 100 mm or rain in New South Wales, which was accurate, it's just that it arrived further West, two days later and was a only 20mm.
So, we shouldn't take Ring's self confidence too seriously and his method, which involves tricky maths and obscure terminology, is a prefect example of cargo cult science. But we don't have to stop there, Ring makes specific predictions that we can test. Just as the worst thing you can say about homeopathy is not that it's impossible for those dilutions to effect the human body, but that homeopathy has been shown to do nothing; the worst thing you could say about Ring's weather forecasting methods is that they don't work. I went digging for some of Ring's old claims and was thrilled to see that my Sciblogs stablemate Gareth Renowden has already done all the hard work for me! Apparently Gareth was been dealing with crazy people and weather even before he launched Hot Topic, and back in 2006 he got his hands on on Ring's predictions for rainfall and sunshine hours in each of the major centres. Gareth compared those predictions to the actual values and to the long term average kept by NIWA.
There's a bunch of stuff that can be done with that data (which Gareth kindly made available for anyone to download), but the most important thing (and this holds for almost any statistical analysis) is to take a look at it. Here's what I came up with for the rainfall data using the rather wonderful ggplot2 and inkscape :
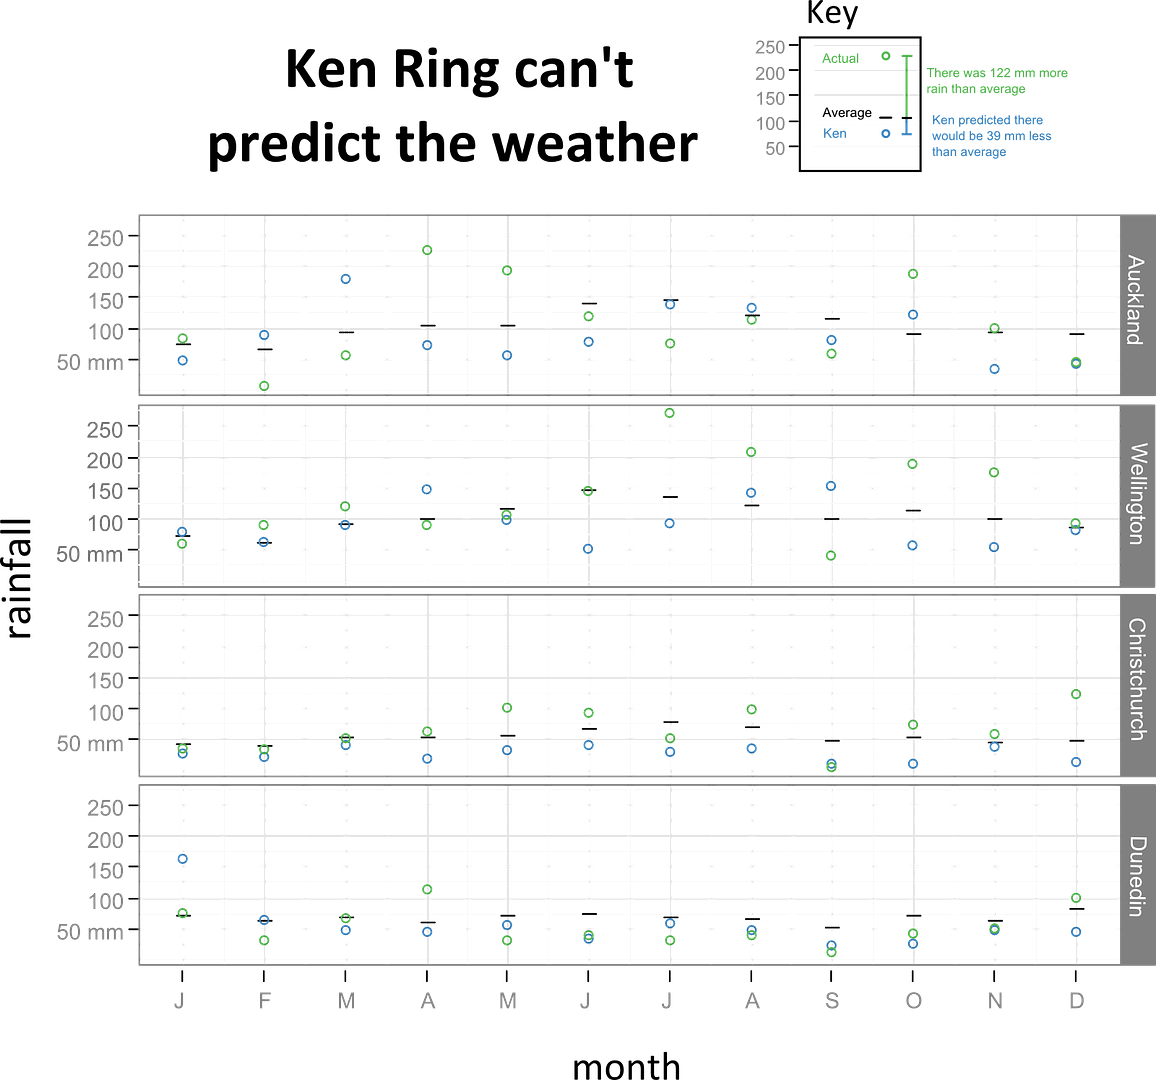 You can click on the graphic above to get a bigger version. In these graphs the long term average for each observation is the black line, Ring's predictions if the blue circle and the actual rainfall for that month in that city is the green circle.
Now, let's test the accuracy of Ring's predictions, but against what? Statistical tests often compare a set of results to what you might expect to get "by chance" but that's not very helpful in this case. For one, it's not clear what the range of possible values should be, and second, comparing the forecasts to numbers picked at random ignores the seasonal effects everyone knows contribute to weather. You don't have to know the position of the moon 18 years ago to know that Auckland is more rainy in July than January. Instead, let's compare Ring's forecasts to the easiest forecast you could ever make - just saying rainfall for a given region in a given month would match the long-term average. If there was anything to Ring's methods he should be able to do better than that. He didn't, on average Ring's prediction was 52.5 mm out from the actual rainfall where as "predicting" the average would have been 37.25 mm out.The long-term average was a better predictor, averaging 15.15 mm closer to the actual rainfall with a confidence interval spanning from -0.4 and 31 mm. We can't (quite) say from that data that Ring's forecasts have less predictive power than the long term average, but there is absolutely no evidence they're any better.
Let's lower the bar a little and forget about how close to the true value Ring's predictions came. Was he at least able to get on the right side of the average? If he predicted a drier August than average was the real value likely to indeed be direr? In this case, if you just tossed a coin 48 times, calling heads drier and tails wetter, you'd expect to be right about half the time. And would have done better than Ring. His prediction was only on the right side of the average 17 times in 48 attempts, about 35% accuracy and significantly worse that you would expect to get from tossing a coin (if you're one of those p-value fetishists p, in this case, is equal to about 0.03) .
So Ken Ring can't predict the weather. That probably doesn't surprise anyone reading my blog or at sciblogs.I wish it surprised me that the uselessness of Ring's forecasts is no barrier to him being taken seriously, selling books and appearing on radio and in newspapers. The host of the show that started by little investigation evidently took some flack for having Ring on (it was a National Radio after all) and his defense amounted to "well, we just let these people talk and you can decide what you think about it". That seems impossibly weak to me, surely the least we should do is ask people who make outrageous claims to show what evidence they have to support those claims. I'm pretty satisfied there is nothing in astrological weather forecasting, but if advocates of the method really want to put it to the test it would be easy. Get someone to provide a year's worth of old weather maps but let only half of them be of the right vintage for their method (about 18 years in Ring's case) and see if the forecasts from the supposedly predictive weather maps are better than the ones from weather maps chosen at random. How likely do you think it is that test will be run?
Labels: pretty data, sci-blogs, science and society, skepticism
Tuesday, August 24, 2010
Sensitivity, specificity and predictive power
There was quite a buzz last week about a study showing a 15 minute brain scan could diagnose autism with "an accuracy rate of 90%" (1,2,3,4 ...). Almost every news outlet that ran with the story seemed to think this new test would pave the way for a quick and efficient screening program for autism. But, as Carl Heneghan at the Guardian pointed out, the ability of a test to correctly diagnose someone with a condition is only one factor that contributes to how useful a test will be. The maths underlying the difference between the accuracy of a test and it's predictive power is famously difficult to grasp, so I thought pretty pictures might do the trick.
50% of the participants of the study that spawned all the fuss had autism, the rest did not. The 90% figure that made the headlines is ability of the brain scan to corroborate the autism diagnosis among the 50% of participants already diagnosed with autism. In other words, the test has a 10% false negative rate. The ability of a test to correctly assign someone with a condition to that condition is called the sensitivity. All of the headlines, and most of the stories, that reported the story failed to mention that the test is worse at picking non-autistic brains from scans. It has an 80% chance of correctly identifying someone as non-autistic (a 20% false positive rate), we call that measure the specificity . So, what do those two rates mean when we run the tests on the study participants? If there were 50 autists and 50 non-autitsts you end up with results like this:
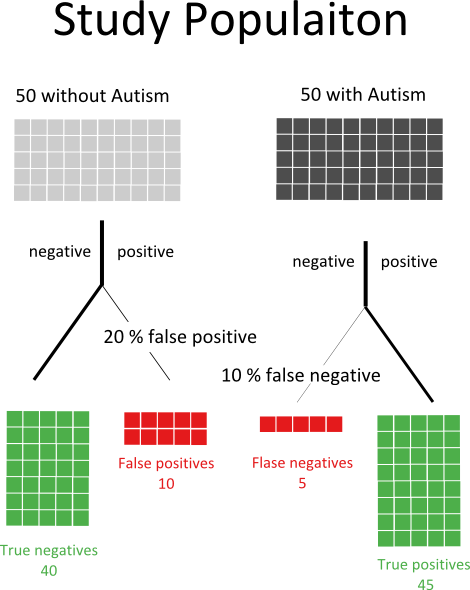
Now, imagine you were in this study population, you didn't know if you were autistic or not, and you got a positive result. How sure could you be that you actually had autism? You might think the answer was 90%, afterall the test is 90% accurate right? In fact, you have to consider the possibility you are one of the ten people we expect to get a false positive result. The probability of having autism if you have a positive test is actually the number of true postives divided by the total number of positives:
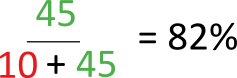
So, the test is pretty good but once you include the chance that you have a false-positive the predictive power of the test goes to about 82% . It get's much worse. In the example above we started with autism rate of 50%, in the real world it's something closer to 1%. Let's presume that we aren't going to start a massive screening program for autism, and instead say that 10% of the people referred to doctors for perceived problems in social and educational development actually have autism. How would out test work on that patient population?
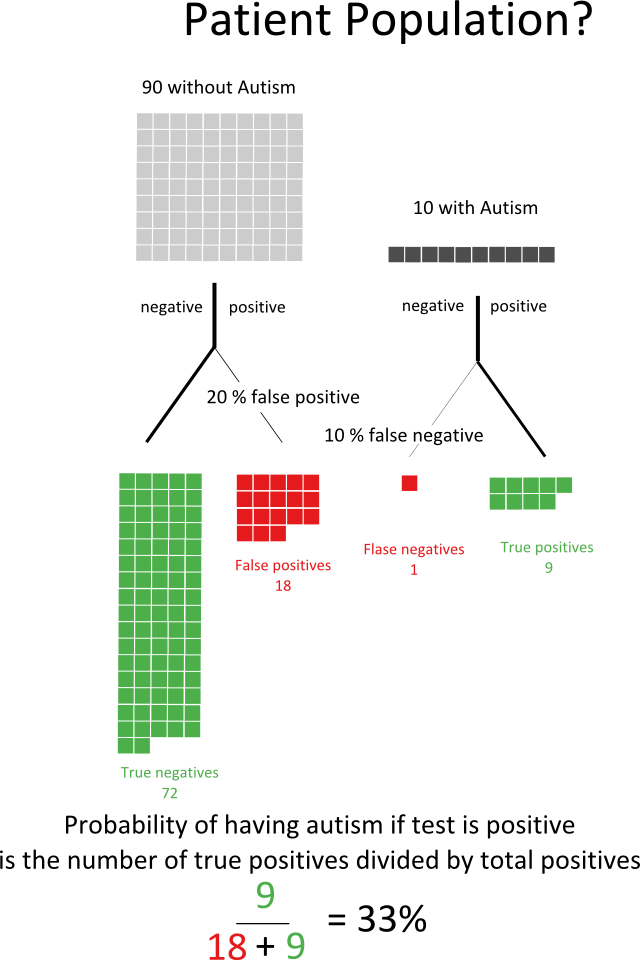
Now if you got a positive result you could still say you probably don't have autism! The predictive power of the test has fallen to 33%. It get's even worse when you think of actually screening the whole population - if 1% of people tested for autism actually had autism then the predictive power of this test would fall to 4.5%.
This problem isn't limited to the new autism scan - any test for a disease which is rare will need to have a very high sensitivity and especially specificity for it to be useful. You sometimes hear people complain that the like of a prostrate cancer screening program using the Prostate Specific Antigen (PSA) test is part of the medical professions attempt to alienate men. In fact, the PSA test has a low specificity. If you were to screen all men for PSA you would get a lot of false positive results, which would lead to a lot of unnecessary biopsies. That's not just an expensive problem, any medical intervention carries a risk so those biopsies would be placing large numbers of men at risk for no good reason. That's not to say the PSA test doesn't have it's uses, if instead of screening all men you only test those who already have a higher risk of prostate cancer you will descrease the number of false positives and the test's predictive power will increase.
Labels: pretty data, sci-blogs, science, science communication, statistics
Friday, April 23, 2010
Garth George: wrong, wrong, 2.75 million times wrong.
Urrrgh, I screwed up the maths here. Garth George is really, really wrong. But sadly he's not the wrongest person ever. A post showing the error of my own ways can be found here and the last graph now includes my own error.
Garth George has this climate science stuff sorted out, it's a scam you see. And even if it weren't, New Zealand's emissions make such a tiny proportion of the worlds carbon dioxide we should just do nothing. You want evidence or New Zealand's tiny carbon footprint? Well, George doesn't need evidence because he has his suspicions:
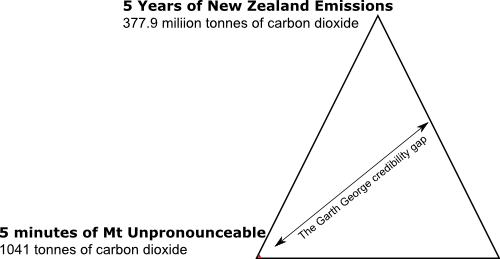
I suspect that the eruption of Mt Eyjafjallajokull in Iceland shot more gases into the atmosphere in five minutes than New Zealand would in five years.
But, as Gareth Renowden points out at Hot Topic, George's suspicions don't match the data. In order to work out how much carbon dioxide Mt Unpronounceable (Paul Litterick's joke, not mine) was shooting into the atmosphere the Guardian took the surprising step of asking some scientists. The upper bound of their estimates is 300 000 tonnes of carbon dioxide per day (or about 1040 tonnes in 5 minutes). Impressive, but not much when compared with the 377 million tonnes New Zealanders managed between 2004 and 2008.
Amazingly, Garth George's estimate is out by a factor of 2.75 million 375 000 [damn!]. That's equivalent to estimating the driving distance between Dunedin and Auckland as being 3.7 metres. I couldn't let a week that combined such breathtaking stupidity with this nice infographic go without memorialising George's folly:
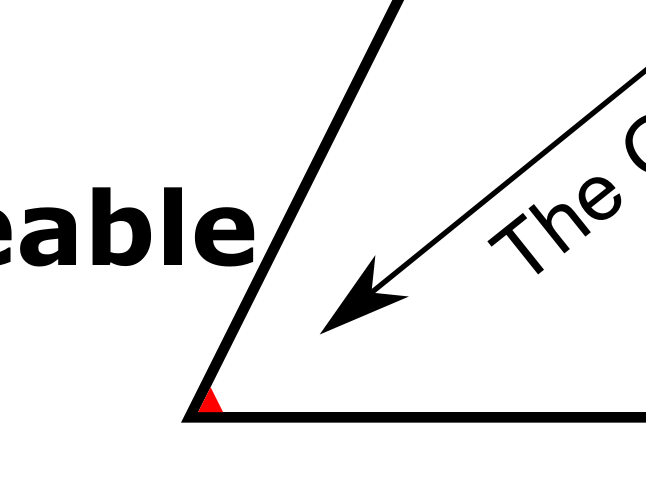
And, because it's pretty hard to see those few red pixels, a close up:
I've just spent a lunch break trying think of any one who has ever made a larger error of estimation. I couldn't come up with one, but here, to provide some context, is George's error against some of history's more famous mis-measurements (if you have some more to add I'd be happy to hear them, especially if you can beat George's effort):

Labels: climate change, environment and ecology, media, pretty data, sci-blogs
Monday, April 19, 2010
Relative Risk Averse
Over at sciblogs Peter Griffin has a post about apparently contradictory evidence on the role of multi-vitamins in breast cancer. We probably shouldn't be too surprised that different studies can look at the same question and get a different answer - biases, methodological errors and sheer dumb luck can affect the results of individual studies. For that reason we should try to draw conclusions on a body of literature, not a single paper. The Guardian's article probably does the best job of summing up how the new paper should update our picture of breast cancer risk:
Let's compare that with The HeraldIf you are a woman and regularly take a multivitamin, you may be concerned by these findings. However, we don't yet know whether multivitamins actually increase the risk of breast cancer. We need more studies.
However, we also don't know whether these supplements have benefits for most healthy people. If you eat a well-balanced diet, you might reconsider whether you need to take a multivitamin.
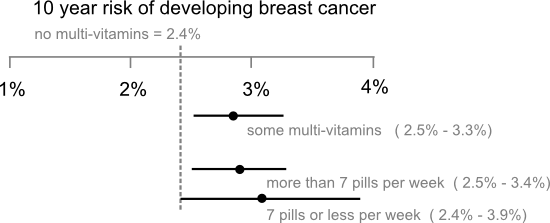
How can the Guardian be so calm when the Herald is clearly terrified? Part of the reason is the Herald's article, like most stories on heath studies, is parroting a potentially misleading statistic called the relative risk. That's the difference in the risk of getting some disease for a group exposed to some factor (in this case multi-vitamins) and those that aren't exposed. The relative risk can be a useful summary of a study's results, because it tells us how big an effect the risk factor being study has on the disease in question, but it doesn't tell the whole story.Women who regularly take multi-vitamin pills face a much higher risk of breast cancer, a study has found.
The Swedish study, which looked at more than 35,000 women aged between 49 and 83 during a 10-year period, found that women who take daily multi-vitamin pills are nearly 20 per cent more likely to develop breast cancer.
Take the recent story about pancreatic cancer and soft drinks. That study found people who regularly drink soft drinks face an 87% greater risk of developing pancreatic cancer, which sounds like really bad news until you realise your lifetime risk of pancreatic cancer is about 0.2%. If the papers had to run a story saying the absolute risk of pancreatic cancer moved from 0.2% to 0.37% when you drank a couple of cokes a week the headlines would have been a little more subdued than they were.
The other problem is papers usually focus exclusively on the point estimate of the relative risk ("nearly 20% more likely", "87% higher risk"...) and ignore the uncertainties associated with those estimates. Carl Sagan got a little religious about error bars in The Demon Haunted World where he described them as "pervasive, visible self-assessments of the reliability of our knowledge" and wished all political statements included them. In fact, error bars don't represent the full extend of our uncertainty, only how far our estimate of the risk might be from the mark if the study has avoided selection biases and applied its methods correctly. Still, wouldn't it be nice if newspaper stories on new medical studies had a little graphic like this to but the results in context:
Labels: health, pretty data, sci-blogs, statistics
Thursday, March 18, 2010
Illustrating Carl Zimmer's Readers
Carl Zimmer has been wondering what to do next. Obviously, he's going to keep writing his wonderful science stories and continue to maintain the Science Tattoo Emporium but where to do that , and how to make money from it, is less clear. Carl's a scientific kind of guy, so he wanted get some data to inform his decision. The results of his reader's survey are out and they're interesting. But, for all Carl's skill with words data wants to be pretty, so here are a couple of the the key conclusions of his reader's survey illustrated with the help of ggplot.
Where do readers of The Loom get their science news?

How much would they pay for an e-book from a scince writer they liked?

Labels: ggplot, might interest someone, pretty data, sci-blogs, technology

All content not otherwise marked is licensed under a Creative Commons Attribution-ShareAlike 3.0 Unported License.


